Visualizing a network of keywords in Arabic linguistics
Update 2019-09-08 — Editing
Update 2019-03-23 — Editing
When I read books and articles related to my research, I usually take notes of what is most interesting to me, with each note in separate text file. To each file I add one or more keywords from a set list. A note can contain any arbitrary combination of keywords. The idea with these keywords is to allow me to sort or filter the notes by topic. A while back it struck me that these keywords form a network of connected nodes and that this network could probably somehow be visualized. Some ideas completely obsess you and won’t leave you alone. The only way to get them out of your head is to let them materialize in the real world.
It is important to note before continuing that these are keywords of my notes of the sources, not of the sources themselves. They are intended to capture what I find to be of interest in the respective article or book from my particular vantage point.
Due to the consistent formatting of file names and keywords in the notes it was pretty easy to generate a database of all connections between keywords and references, like this:
Ferguson (1997)	standard-language
Ferguson (1997)	historical-linguistics
Fisher (1996) 	standard-language
Fisher (1996) 	historical-linguistics
Fisher (1996) 	English
Now I only needed to find a way to draw all these relations on a two-dimensional surface. My first attempt was to make two columns, one with references and one with keywords, and with lines connecting the two. An hour later of bash, R, and LaTeX spaghetti scripts I ended up with the document below, intended to be printed on A3 paper.
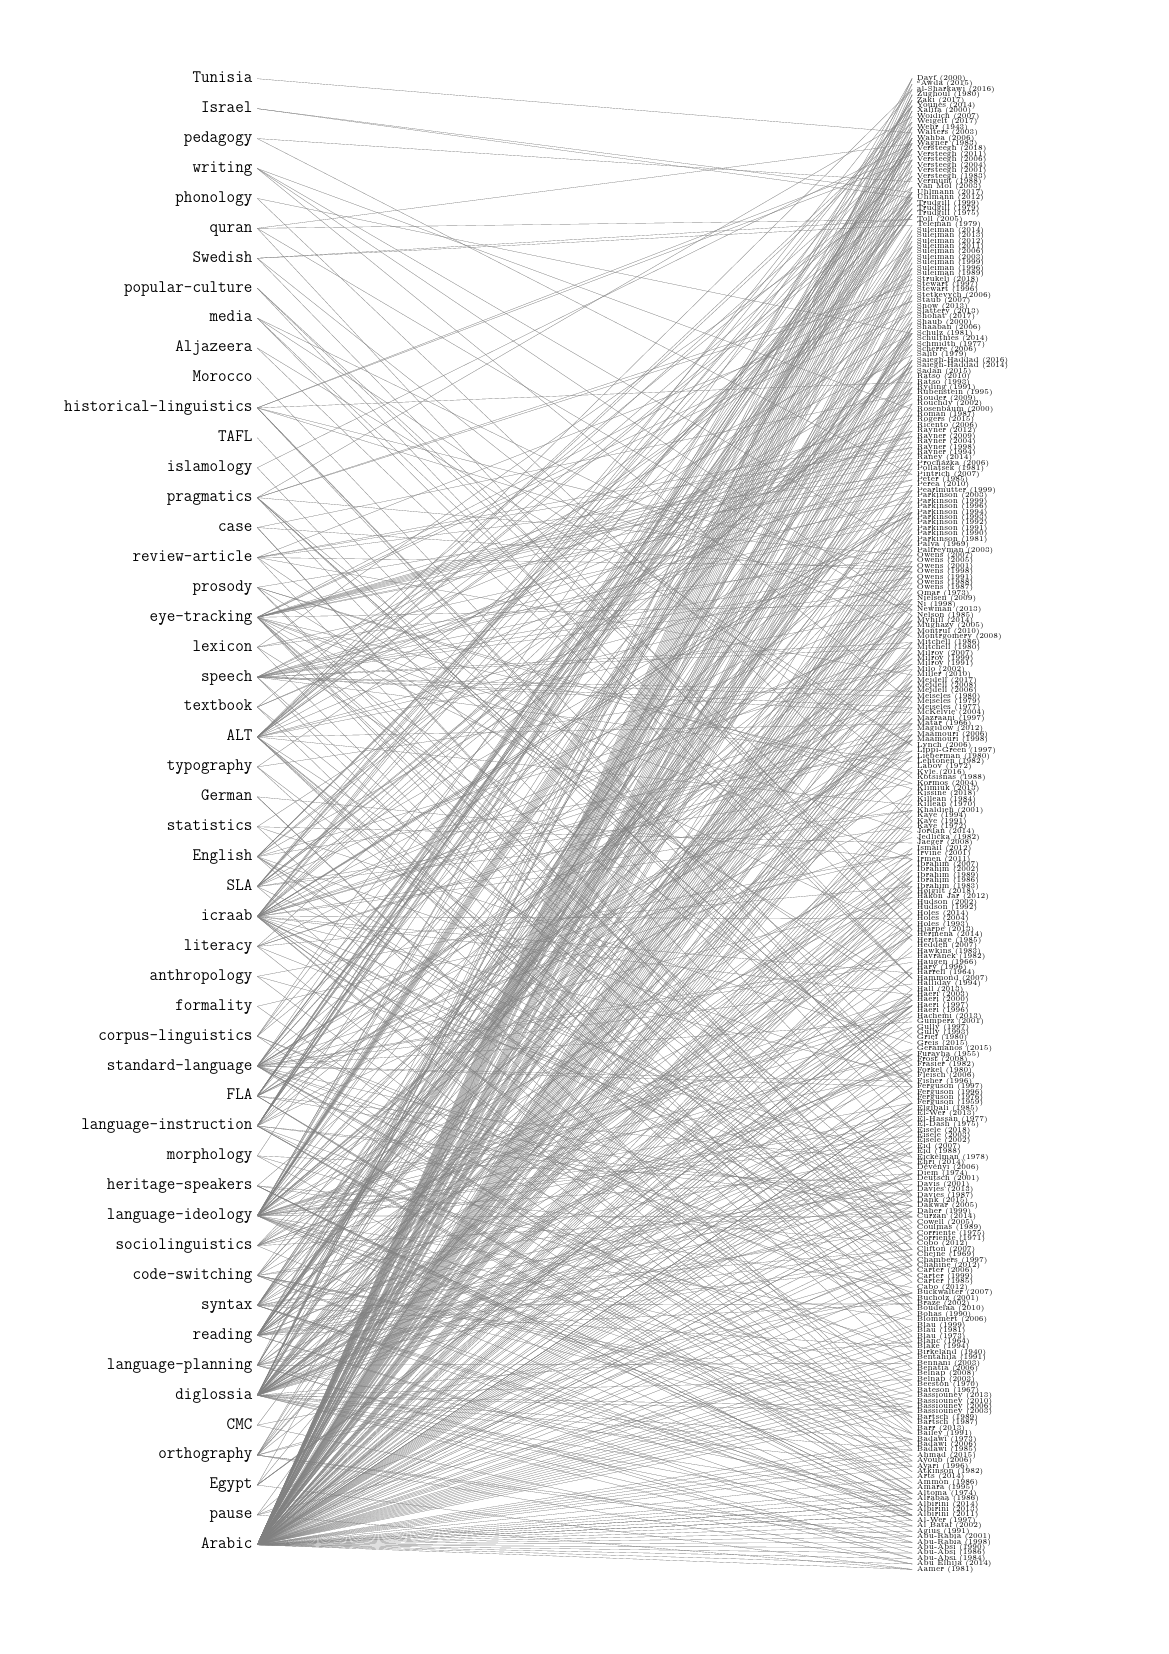
It looks kind of nice, but you cannot get much information out of it, other than what my main areas of interest are. The references are so tightly packed together that it is difficult to make out which line goes to which reference. Also, the positioning of keywords and references does not encode useful information: they are simply ordered alphabetically (from bottom to top).
So I looked up some methods to plot networks and found the GGally package for the statistical programming language R. It allows you to plot networks using one of several algorithms of node placement. I tried all of them out and found one, the Kamada-Kasai algorithm, that produced a plot that was pretty close to how I had imagined it. The first attempt, excluding some unconnected node islands, looked like this:
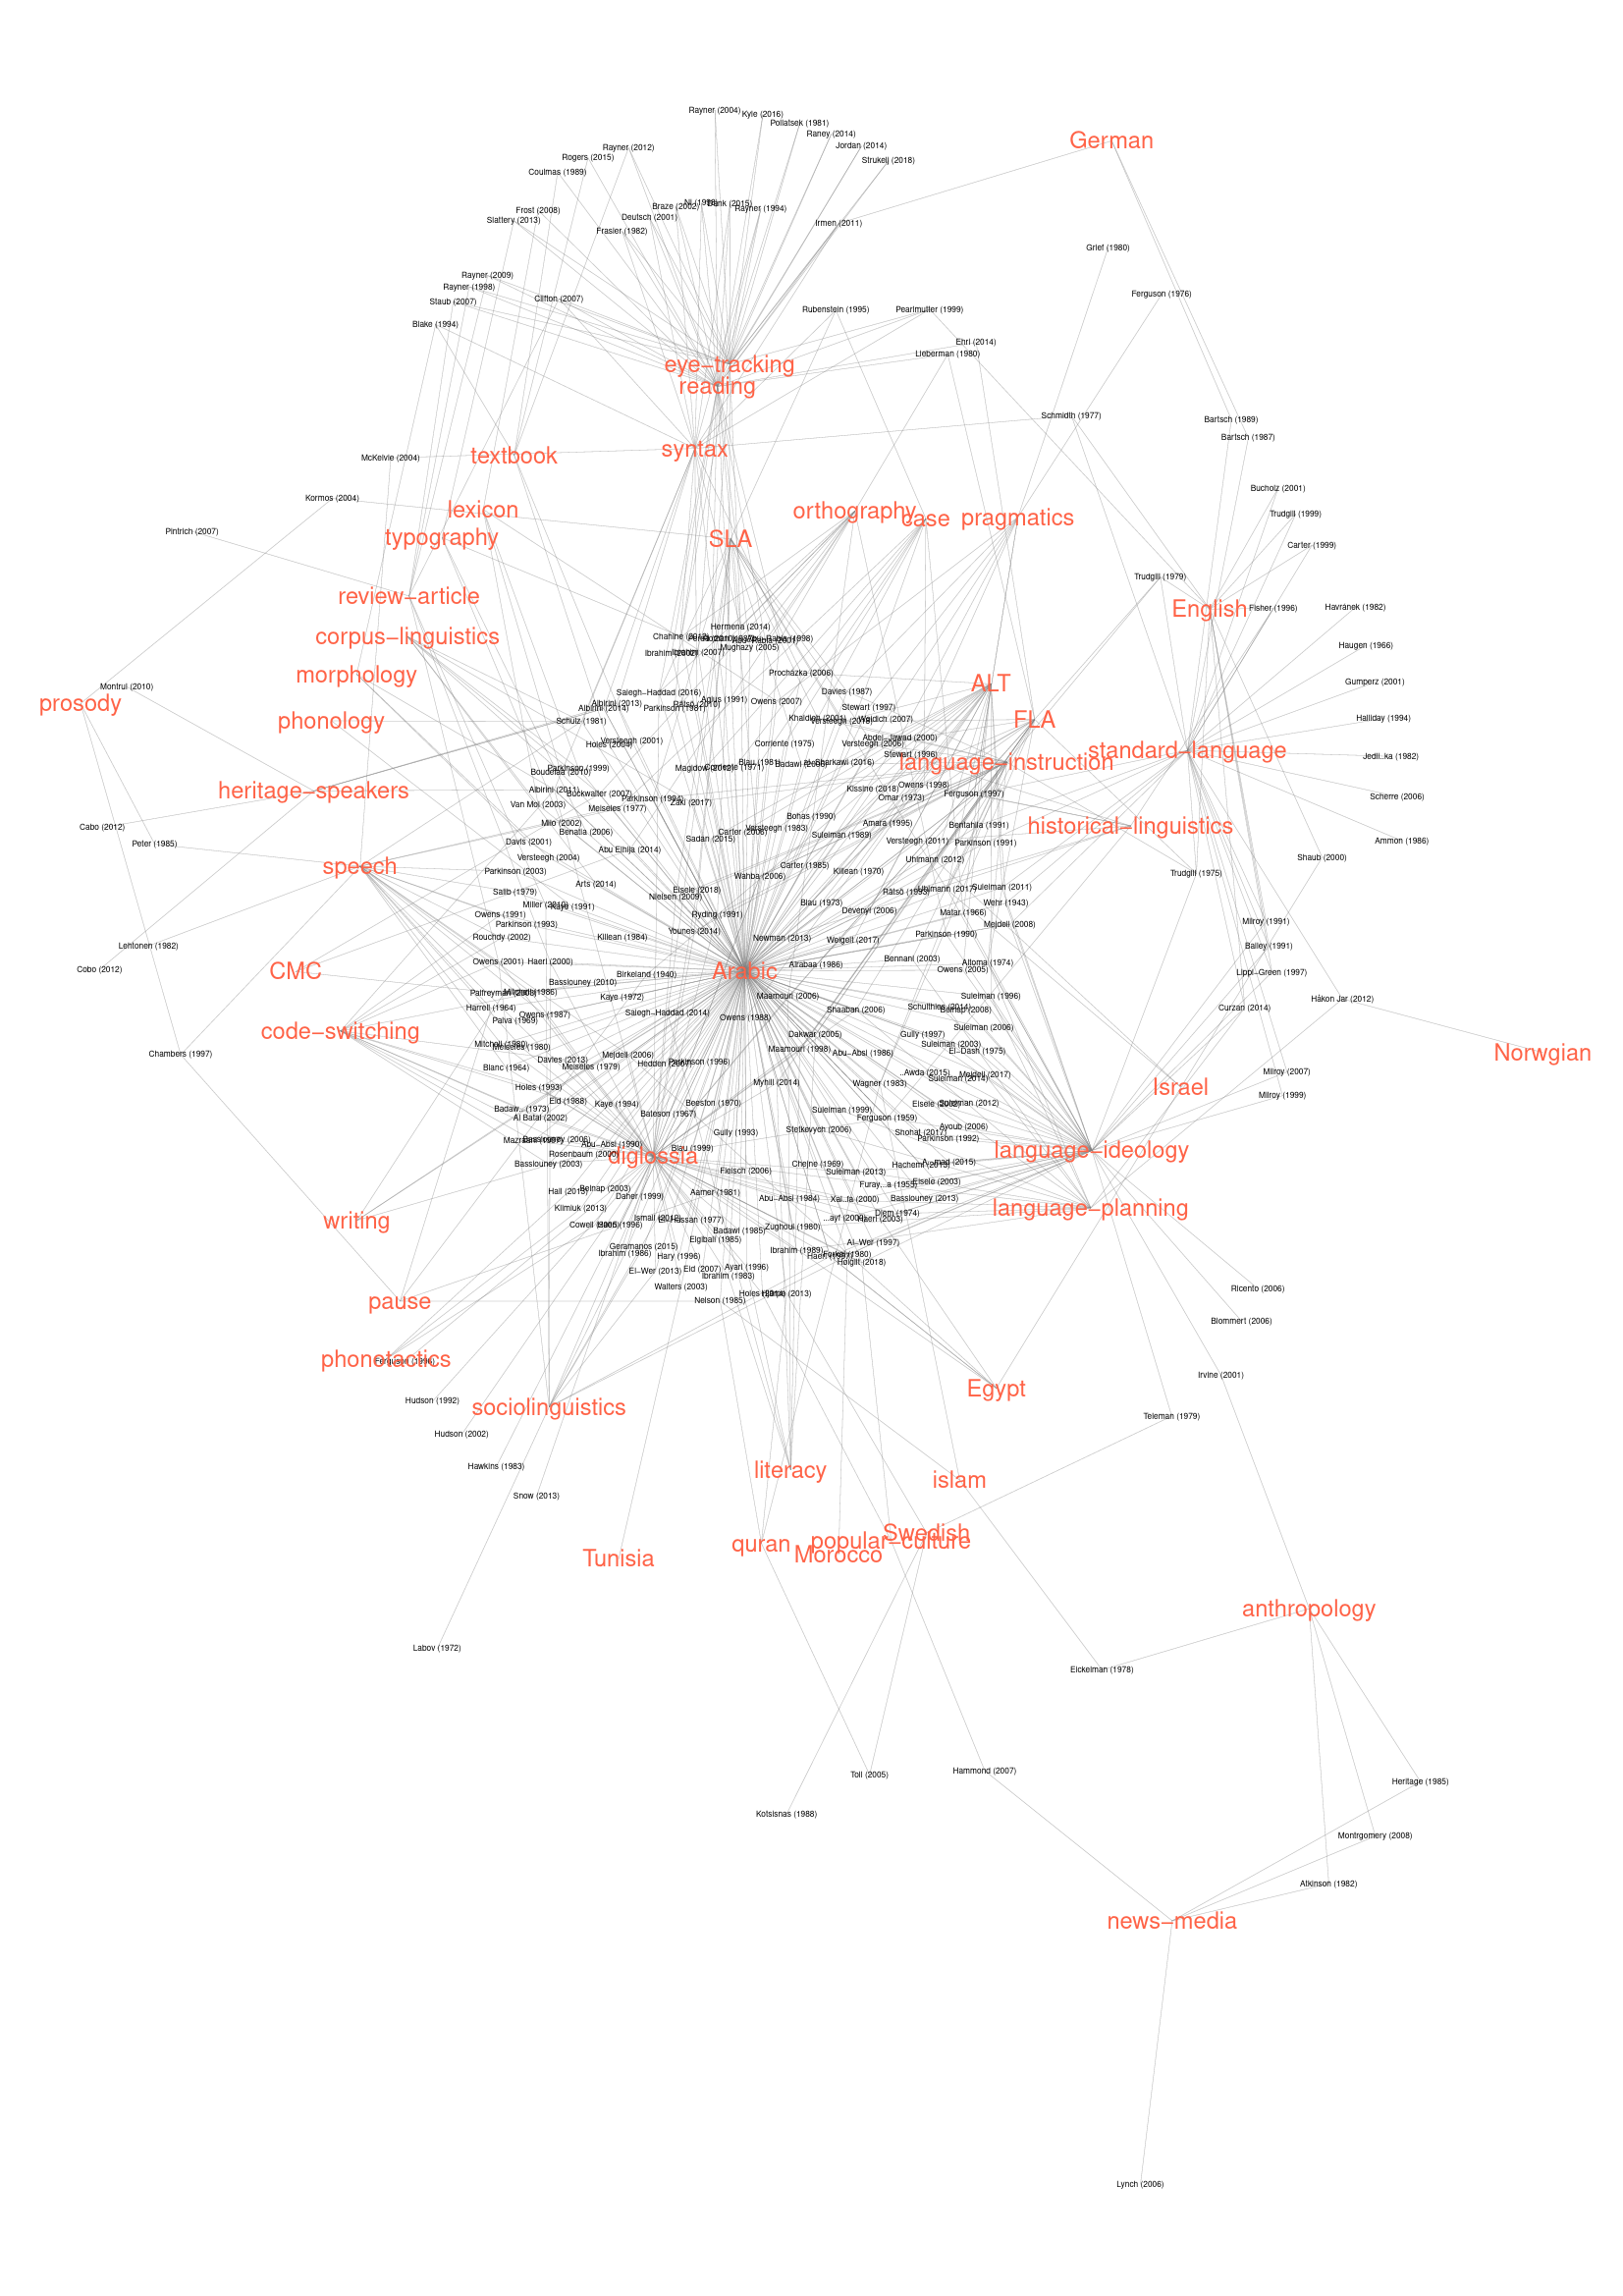
Pretty cool, but since almost everything is connected to the central keyword Arabic it is too dense in the middle. In the periphery things are more clear, such as the connections between eye-tracking and reading at the top, and the connections between standard-language and language-ideology to the right. Also, I like to think of this plot as depicting the world I’ve been living in the last seven or so years; a big mess of Arabic which everything centers around, with outgrowths of language ideology, eye tracking, reading, and some other stuff, all organically grown together in a big blob-monster of interconnected texts.
To make the whole thing less dense and more practically useful, I plotted the data with the same method, but now only including notes that have the keyword Arabic, while not including this keyword as a node in the plot. Below is the result.

Now it’s much more readable, and you can actually retrieve information from it. A good plot is one that allows you to see both larger structures and to pick out detailed information. On the larger scale in this plot you can see for example the blob of diglossia, and that it is densely connected in my notes with language-planning, language-idoelogy, code-switching and literacy. ALT (the Arabic Linguistic Tradition), at the bottom, has a bunch of references all to itself, but is also connected with language-ideology and language-instruction. You can also zoom in (conceptually, or literally on your favorite pdf-reader) on, say, the space between diglossia and language-ideology to see what references I have notes on that deal with those two topics in combination.
This project has been quite satisfying, not the least because it gives me a sense of actually having achieved some reading the last couple of years. The practical use I have found in the plot so far is that it makes interesting things I have read rediscoverable, by placing them in a meaningful context. I find myself sometimes staring at this plot, following its nodes and angels, mentally revisiting and reminding myself of things I read several years ago.
But most of all it just looks impressive.